
10 games remaining in the season. That means probably another two of these posts checking in on how the Caps are performing, and investigating if there are any troubling patterns in the recent play. With a difficult remaining schedule, the next 10 games might be very telling of what to expect out of this team in the playoffs (provided they make it). Most of the remaining opposition are playoff-bound teams, and there’s that weird thing about the playoffs, where you’re going to play good teams.
Let’s get to it.
Playoff Pacing

Almost exactly where they were 5 games ago. Just a touch above a 100 point pace. They should definitely be in the playoffs with 100 points. They were able to tread water over the last 5 games, despite some decent opposition. The Rangers, Bruins, and the Wild are some tough teams, and the Stars are better than their record would indicate, I believe. Obviously Buffalo isn’t a good team this year – and fortunately for the Caps. That game would have been a loss if it were any other team given the Caps’ performance in that game.
Possession


Possession is swinging up quickly over the last 3 games. And that’s even with 2 out of 3 teams in the top half of score adjusted possession. Winnipeg should be a good test tonight. If Nate Schmidt can convince Barry to stay in the lineup that too should boost the possession numbers in the coming games. I would like to see Kuzya with some more skill on his line though, he seems to be playing really well lately and could probably serve the Caps better if he were skating with someone not hindering him (spoiler: I’m talking about Brouwer, not Glenncross – I have nothing but good things to say about that guy right now).
PDO & Percentages


Ho-hum here. As usual, PDO doesn’t really tell us much. Caps are still maintaining an above average PDO – but I’ve mentioned before that this shouldn’t be alarming nor should people call it unsustainable. The Caps have the talent to hold higher than league average percentages, I feel. But let’s look at the components.


Save percentage rising, and shooting percentage falling. I guess that could throw up some red flags, but in my rose-colored glasses, they’re good red flags. I’d honestly expect the shooting percentage to maybe rise a bit in even strength. Again – the offensive talent this team has should be able to maintain better than 7% even strength shooting. We all know Holtby can maintain the even strength save percentage we’re seeing. Well it may come down a bit, but I’d be surprised if it takes a nosedive. With these kinds of percentages, and winning the possession battle, we should definitely expect the Caps to win more games than they lose in the remaining 10 games. But, we’re Caps fans, and we can never actually expect that kind of thing.
Special Teams: Summary


Things have been pretty volatile in the rolling 10-game special teams’ performance. The Caps really do seem to be feast or famine in the special teams department. Although they’re right in the middle of the most recent feasts and most recent famines, so I don’t know where they’re going from here. I guess let’s look at the power play and penalty kill individually.
Special Teams: Power Play


I still like what I’m seeing in this data. The shot generation looks to have peaked, but if it can sustain that level of production, that can only mean good things. 2.5 shots per power play opportunity is certainly a luxury. Because, well let’s face it, the Caps are not getting the beneficial calls lately. Which is clear in the average power play opportunities per game being at its lowest in months. As I transition into the penalty kill, it’s worth noting the rather large spike in the power play conversion rate, and contrast it to the rather stagnant STI. So we can probably expect some less than desirable trends on the other side of the special teams.
Special Teams: Penalty Kill


Actually, not what I was expecting. Kind of pleasantly surprised honestly. There was that awful example in Dallas, even though there wasn’t anything systemically different apparent. I hope we see more of the recent trend in the discipline arena. Although, I could do without Brouwer repeatedly cross checking a player when the Caps are up 2 goals. That kind of crap will bite you in the ass more often than it won’t.
Well, the current 10-game rolling data suggests the Caps will net a positive shot differential from special teams alone. So, just don’t piss off the refs or do stupid, ill-advised garbage after/before the whistle in hopes of skewing the opportunities heavily in the opponent’s favor. Looking at you Chimera, Brouwer, and our supposed veteran leadership.
Fenwick Percentage: Score State


The Caps are slowly digging themselves out of the hole they were in back since the last Hurricanes game. Tied performance is much better, but the rest of the score scenarios are a bit mercurial. Funny to note currently that the best the Caps are in terms of unblocked shot attempts is when they’re up by 2+ goals. More of that scenario please.
Corsi Percentage: Score State


Well the Caps are positive in total shot attempt percentage over the last 10 games, no matter the score state, except for the dreaded 1 goal lead. So as long as they get the lead and immediately expand upon it, they’re all good.
Fenwick Rates: Score State


Tied unblocked shot attempts are doing the right things in both directions of the ice. That’s about all I have to glean from these charts. Although it is interesting that the Caps shoot the puck more when they’re tied than when they’re down 1, and they allow more shots when they’re tied vs when they’re up 1. Little things amuse me.
Corsi Rates: Score State


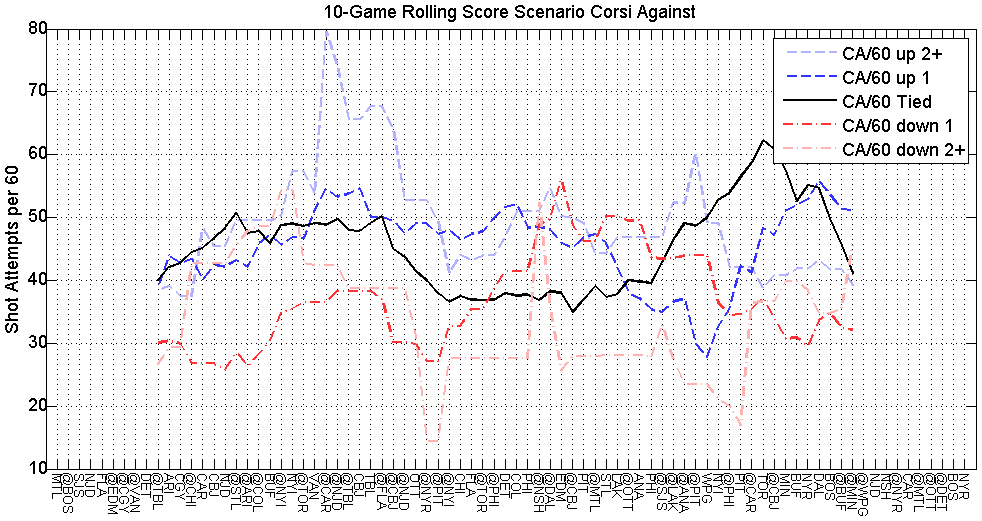
Some of the same stuff, but nothing really unique worth commenting on. So let’s close this thing out.
Summary

Summary? Things are pretty level where they are. We have a good picture of the Washington Capitals. A positive possession team, with enough offensive and goaltending talent to sustain better than league average percentages, and a team that can be pretty volatile in special teams. Those elements currently add up to a 100 point pacing team in probably one of the stronger divisions in the league this year. They also mean that a playoff series for this team could very well be decided by officiating or a hot or cold streak on either special team. So…par for the course for Washington Capitals playoffs in recent memory.
Make sure to pay attention to the remaining 10 games, and I’ll try to check back in after the next Carolina game, right before a murderous season-ending stretch.
